The linear model is a simple but powerful statistics model for predicting. However, sometimes, the relationship between given features and labels is not linear, such as the diameter of a circle and the area of it. But this does not necessarily mean the linear model is not suitable for them. By applying certain transformations, the model can still be optimized for more realistic problems. Box-cox transformation a group of transformations, which can be represented as \(\eqref{box-cox}\). \[ \begin{equation} y^{(\lambda)} = \begin{cases} \frac{y^\lambda - 1}{\lambda}, \qquad \lambda \neq 0 \\ \ln y, \qquad \lambda = 0 \end{cases} \end{equation}\label{box-cox} \] By choosing the best \(\lambda\), the model can be optimized. For the diameter and area case, just apply the transformation with \(\lambda = \frac{1}{2}\) to area observations, and the relationship between labels and features would be linear.
Note that box-cox transformation is just a transformation instead of a specific tool to fine-tune the linear models. It can also be used for normalizing data so that it is more likely to conform to normal distribution (boxcox in scipy.stats does exactly this if the lmbda parameter is not given).
Representation of Linear Model
I suppose "linear model" is already a household name, but in order to avoid unnecessary misunderstanding, I would still give the representation of the linear model.
One-Dimensional Case
Let's consider the 1-dimensional case: let \(x\) be the feature variable, and \(y\) be the label, the linear model can be represented as \(\eqref{1d-lm}\). \[ \begin{equation} y = \beta x + c + e \end{equation}\label{1d-lm} \] Where \(\beta\) represents the slope, and \(c\) represents the bias. We assume \(e \sim N(0, \sigma^2)\).
Multi-Dimensional Case
As for the multi-dimensional case, say, the feature \(\textbf{x}\) consists of multiple fields, we can still apply the linear model, as \(\eqref{md-lm}\). \[ \begin{equation} y = \beta \textbf{x} + c + e \end{equation}\label{md-lm} \] Suppose this is a \(p\) dimensional linear model, we represent \(\textbf{x}\) and \(\beta\) as follows: \[ \textbf{x} = \left( x_1, x_2, \dots, x_p \right)^T \\ \beta = \left(\beta_1, \beta_2, \dots, \beta_p\right)^T \] By attaching a \(1\) in front of vector \(\textbf{x}\), the bias term \(c\) can be intergrated into the term \(\beta \textbf{x}\), and now \(\textbf{x}\) and \(\beta\) should look like this: \[ \textbf{x} = \left(1, x_1, x_2, \dots, x_p \right)^T \\ \beta = \left(\beta_0, \beta_1, \beta_2, \dots, \beta_p\right)^T \] Now our linear model is more simplified, as \(\eqref{smd-lm}\). \[ \begin{equation} y = \beta^T \textbf{x} + e \end{equation}\label{smd-lm} \]
Model for Training Set
Only a model is definitely not enough for prediction. The training set, a set of feature and label pairs, represented as \(\left\{ \textbf{x}_i, y_i \right\}_1^N\), should be provided to train the model. Theoretically, each pair can be represented as our model approximately, for \(i\) th pair, it is \(y_i = \beta \textbf{x}_i + e_i\). If we write them together, we get the vector representation of the linear model over the whole training set, as \(\eqref{t-lm}\). \[ \begin{equation} \textbf{y} = \textbf{X} \beta + \textbf{e} \end{equation}\label{t-lm} \] Where \(\textbf{y}\) and \(\textbf{x}\) are represented as follows: \[ \textbf{y} = \left(y_1, y_2, \dots, y_N\right)^T \\ \textbf{X} = \left(\begin{matrix} 1 & \textbf{x}_1^T \\ 1 & \textbf{x}_2^T \\ \vdots & \vdots \\ 1 & \textbf{x}_N^T \end{matrix}\right) \] According to the assumption of linear model, for each \(i\), \(e_i \sim N(0, \sigma^2)\), and \(e_i\) and \(e_j\) are independent if \(i \neq j\). Thus, \(\textbf{e}\) should conform to \(p\)-dimensional normal distribution, represented as \(\textbf{e} \sim N(0, \sigma^2I)\), where \(I\) stands for the identity matrix.
Finding the Best \(\lambda\)
Box-cox transformation is a group of transformations, if \(\lambda\) is different, the transformation is different. So what is the best transformation to find-tune the linear model? The maximum likelihood would be a good choice to obtain the optimal \(\lambda\), that is, maximizing the probability of the training set to appear. The density function of \(p\)-dimensional normal distribution \(N(\mu, \Sigma)\) is as \(\eqref{pn_den}\). \[ \begin{equation} f(\textbf{x}) = \frac{1}{\left( 2\pi \right)^{\frac{n}{2}}\left|\Sigma\right|^{\frac{1}{2}}}\exp\{-\frac{1}{2}\left( \textbf{x} - \mu \right)^T \Sigma^{-1} \left( \textbf{x} - \mu \right)\} \end{equation}\label{pn_den} \] By considering \(\eqref{t-lm}\), \(\textbf{y} ^{(\lambda)} =\textbf{X}\beta^T + \textbf{e} \sim N(\textbf{X}\beta^T, \sigma^2I)\), thus, the probability of the training set to appear, say, the likelihood of the training set can be represented with the density function, as \(\eqref{lkhd}\). \[ \begin{equation} f(\textbf{y}^{(\lambda)}) = L(\beta, \sigma) = \frac{1}{\left(\sqrt{2\pi} \sigma\right)^n}\exp\{-\frac{1}{2\sigma^2}\left( \textbf{y}^{(\lambda)} - \textbf{X}\beta \right)^T \left( \textbf{y}^{(\lambda)} - \textbf{X}\beta \right)\} J \end{equation}\label{lkhd} \]
In \(\eqref{lkhd}\), \(J\) stands for the Jacobi determinant of the transformation. This is required since \(\textbf{y}\) is transformed. In brief, there should be a Jacobi determinant multiplied in the probability density function to compensate, for the transformation may distort the original distribution, make the distribution become 'unbalanced' over all real number values. For a transformation \((y_1, y_2, \dots , y_m) = f(x_1, x_2, \dots, x_n)\), its Jacobi determinant is as \(\eqref{jacobi}\) . \[ \begin{equation} J = \begin{vmatrix} \frac{\partial y_1}{\partial x_1} & \dots & \frac{\partial y_1}{\partial x_n} \\ \vdots & \ddots & \vdots \\ \frac{\partial y_m}{\partial x_1} & \dots & \frac{\partial y_m}{\partial x_n} \end{vmatrix} \end{equation}\label{jacobi} \] Because in box-cox transformation, \(y_i^{(\lambda)} = f(y_i)\), the Jacobi determinant is diagonal, for \(y_i^{(\lambda)}\) is not related with \(y_j\) if \(i \neq j\), causing \(\frac{\partial y_i}{\partial y_j} = 0\). Thus the Jacobi determinant for box-cox transformation is as \(\eqref{bc_jacobi}\). \[ \begin{equation} J = \begin{vmatrix} y_1^{\lambda - 1} & 0 & \dots & 0 \\ 0 & y_2^{\lambda - 1} & \dots & 0 \\ \vdots & \vdots & \ddots & \vdots \\ 0 & 0 & \dots & y_p^{\lambda - 1} \end{vmatrix} = \prod_{i=1}^{n} y_i^{\lambda - 1} \end{equation}\label{bc_jacobi} \]
To obtain the maximum value of \(L(\beta, \sigma)\), the partial derivative of \(\beta\) and \(\sigma\) should be set to 0, as shown in \(\eqref{partial_zero}\). \[ \begin{equation} \begin{cases} \frac{\partial L}{\partial \beta} = \frac{J}{\left(\sqrt{2\pi}\sigma\right)^n}E \left( 2\textbf{X}^T \textbf{X} \beta - 2\textbf{X}^T \textbf{y}^{(\lambda)} \right) = 0 \\ \frac{\partial L}{\partial \sigma} = J E \frac{- \sqrt{2\pi} n + \sqrt{2\pi} \sigma^{-2} \left( \textbf{y} - \textbf{X}\beta \right)^T \left( \textbf{y} - \textbf{X}\beta \right)}{\left( \sqrt{2\pi} \sigma \right)^{n + 1}} = 0 \end{cases} \\ E = \exp \{ -\frac{1}{2 \sigma^2} \left( \textbf{y}^{(\lambda)} - \textbf{X}\beta \right)^T \left(\textbf{y}^{(\lambda)} - \textbf{X}\beta \right) \} \end{equation}\label{partial_zero} \] By removing the redundant terms in the multiplication, \(\eqref{partial_zero}\) can be simplified to \(\eqref{simplified}\). \[ \begin{equation} \begin{cases} \textbf{X}^T \textbf{X} \beta - \textbf{X}^T \textbf{y}^{(\lambda)} = 0 \\ - n + \sigma^{-2}\left( \textbf{y} - \textbf{X}\beta \right)^T \left( \textbf{y} - \textbf{X}\beta \right) = 0 \end{cases} \end{equation}\label{simplified} \] By solving the equation in \(\eqref{simplified}\), the value of \(\beta\) and \(\sigma\) when the maximum value of the likelihood function is reached can be got, given as in \(\eqref{max_par}\). \[ \begin{equation} \begin{cases} \beta = \left(\textbf{X}^T \textbf{X} \right)^{-1} \textbf{X}^T \textbf{y}^{(\lambda)} \\ \sigma^2 = \frac{1}{n} \textbf{y}^{(\lambda)T} \left( \textbf{I} - \textbf{X}\left(\textbf{X}^T \textbf{X} \right)^{-1} \textbf{X}^T \right) \textbf{y}^{(\lambda)} \end{cases} \end{equation}\label{max_par} \] Note that the following equation holds, which could simplify our following computation dramatically. \[ \begin{split} \left( \textbf{y}^{(\lambda)} - \textbf{X}\beta \right)^T \left( \textbf{y}^{(\lambda)} - \textbf{X}\beta \right) & = \textbf{y}^{(\lambda)T} \left( \textbf{I} - \textbf{X}\left(\textbf{X}^T \textbf{X} \right)^{-1} \textbf{X}^T \right) \textbf{y}^{(\lambda)} \\ & = n \sigma^2 \end{split} \] By substituting \(\eqref{max_par}\) into \(\eqref{lkhd}\), the maximum value of the likelihood function is given in \(\eqref{max_ml}\) \[ \begin{equation} L(\beta, \sigma) = (2 \pi e)^{-\frac{n}{2}} J \left( \frac{\textbf{y}^{(\lambda)T} \left( \textbf{I} - \textbf{X}\left(\textbf{X}^T \textbf{X} \right)^{-1} \textbf{X}^T \right) \textbf{y}^{(\lambda)}}{n} \right)^{-\frac{n}{2}} \end{equation}\label{max_ml} \]
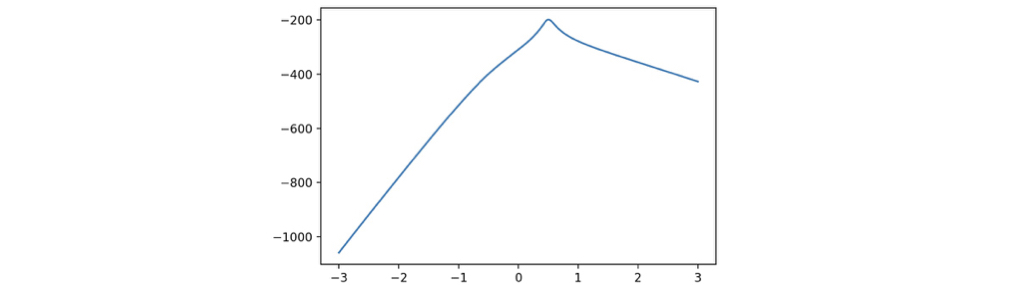
To estimate the \(\lambda\) that maximizes \(L(\beta, \sigma)\), it is okay to remove the multiply terms that do not involve \(\lambda\), so that the equation will be more simplified. After the removal, the logarithm likelihood should be as in \(\eqref{final_ml}\). \[ \begin{equation} \ln L(\beta, \sigma) = -\frac{n}{2} \ln \left( \textbf{y}^{(\lambda)T} \left( \textbf{I} - \textbf{X}\left(\textbf{X}^T \textbf{X} \right)^{-1} \textbf{X}^T \right) \textbf{y}^{(\lambda)} \right) + \ln J \end{equation}\label{final_ml} \] Though deriving the precise \(\lambda\) that minimize \(\eqref{final_ml}\) is hard, this is a single variate optimizing problem. By probing different \(\lambda\) in a certain range and plot the curve of \(\eqref{final_ml}\), an estimation of \(\lambda\) is not hard to get.
Python Implementation
In this section, Python will be used to implement the procedure for deriving \(\lambda\) used in the box-cox transformation. The basic concept of this program is to select a certain number of probes of \(\lambda\) in a certain range, calculate the corresponding logarithm likelihood according to \(\eqref{final_ml}\), then give the \(\lambda\) which have the maximum likelihood.
Implementation
To simplify the calculation for transformed \(\textbf{y}\), known as \(\textbf{y}^{(\lambda)}\), the method scipy.stats.boxcox is directly called, and \(\lambda\) can be specified by assigning its argument lmbda.
Suppose \(\textbf{X}\) is and \(\textbf{y}\) are both 2-dimensional numpy array with shape \(n\) by \(m\) and \(n\) by \(1\), the following code can calculate the logarithm likelihood presented in \(\eqref{final_ml}\).
1 | def log_likelihood(lmbda, x, y): |
Note:
scipy.stats.boxcoxrequires its argument data to be positive. This can be achieved by adding the minimum negative element \(x\_{ij}\) to all elements in its row for all rows. After the prediction, simply subtract the corresponding row by \(x\_{ij}\).
Suppose we need to obtain the potential \(\lambda\) from a to b for t probes (represented as potential_lmbdas), obtaining the \(\lambda\) with maximum likelihood is done as follows. This snippet will calculate the best estimated \(\lambda\), as well as plot a graph of likelihood with respect to
1 | potential_lmbdas = np.linspace(a, b, t) |
Experiment
We generated a 1-dimensional linear regression case for testing. The data is simple enough: let x be the radius of some circles, and y be the corresponding area of the corresponding circles. We added a random noise so that the data looks more real. The snippet for data generation is as follows. 50 radius samples, ranging from 0 to 10 are generated.
1 | x = np.linspace(0, 10, 50) |
The following code will use sklearn.linear_model.LinearRegression to train a linear regression model and plot the prediction with its training scatter map.
1 | regressor = sklearn.linear_model.LinearRegression() |

We can get the \(\lambda\) for box-cox transformation with the following code, which sets the searching range to be \([-3, \ 3]\), and use \(1000\) probes. The graph is illustrated, and the code suggests the best \(\lambda\) is \(0.5075\), which is close enough for the theoretical best \(\lambda = 0.5\).
1 | potential_lmbdas = np.linspace(-3, 3, 1000) |
Now we can fit the linear model again, and plot the new result and the plot shows significant improvement.
1 | regressor = sklearn.linear_model.LinearRegression() |